Lecture 1
Outline
Statistics and variation
Data in statistical analysis
Surveys and sampling
Statistics and Variation
Statistics and statistics
Statistics is a way of reasoning, along with a collection of tools and methods, designed to help us understand the world.
Statistics (pl) are quantities calculated from data.
Variation
Our ability to analyse and draw conclusions from data depends largely on our ability to understand variation.
Data
Data are values along with their context.
Data collected for recording the companies' transactions is called _transactional data_.
Analysis
Business analytics describes any use of statistical analysis to drive business decisions from data.
_Data mining (predictive analytics)_ is the process of using transactional data to make other decisions and predictions.
Data Table
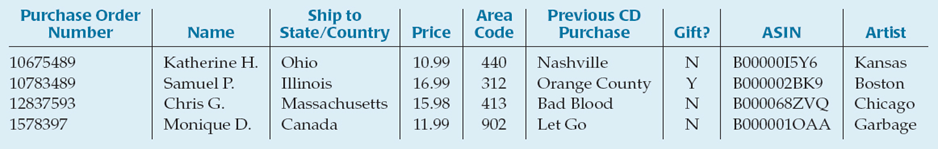
Data are often organized into a data table.
The rows of a data table correspond to individual cases where we record some characteristics.
The characteristics recorded about each individual or case are called variables.
Metadata
Metadata typically contains information about how, when, and where (and possibly why) the data were collected
who each case represents,
and the definitions of all the variables.
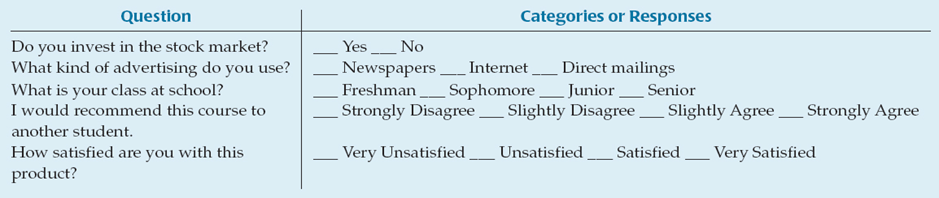
Variable Types
categorical or qualitative variable
when a variable names categories and answers questions about how cases fall into those categories
quantitative variable
when a variable has measured numerical values with units and the variable tells us about the quantity of what is measured
Categorical
arise from descriptive responses to questions like "What kind of advertising do you use?".
may only have two possible values (like yes/no)
may be a number like a zip code
Quantitative
quantitative variables must have units
how each value has been measured.
the corresponding scale of measurement.
how much of something we have.
how far apart two values are.
Identifier
do not have units.
are a special kind of categorical variable.
are useful in combining data from different sources to avoid duplication.
are not variables to be analyzed.
Other
Categorical variables used only to name categories are sometimes called nominal variables.
When data values can be ordered, we say that the variable has ordinal values.
Variables that are measured at regular intervals over time are called time series.
When several variables are all measured at the same time point, the data is called _cross-sectional data_.
Example
Business analysts hoping to provide information helpful to grape growers compiled these data about vineyards in California and Michigan.
Size (acres)
Number of years in existence
State
Varieties of grapes grown
Average case price
Gross sales
Percent profit
Example Variables
Size (acres) [quantitative]
Number of years in existence [quantitative]
State [categorical], _an indicator variable_
Varieties of grapes grown [categorical]
Average case price [quantitative]
Gross sales [quantitative]
Percent profit [quantitative]
Surveys and Sampling
Sampling
A population is a set of similar items or events which is of interest for some question or experiment.
Examining all of it is usually impractical, if not impossible.
Usually, we settle for examining a smaller subset – sample – selected from the population.
Samples that over- or underemphasize some characteristics of the population are said to be _biased_.
Biased sample has different characteristics from the population it is trying to represent.
To make the sample as representative as possible, select individuals for the sample at _random_.
Randomization
Protects by giving a representative sample even for effects we were unaware of.
Makes sure that on average the sample looks like the rest of the population.
Random samples will differ from each other
These sample-to-sample differences are referred to as sampling error even though no error has occurred.
Sample Size Matters
The size of the sample determines what we can conclude from the data regardless of the size of the population.
The size of the population doesn't matter at all (for small samples)
What fraction of the population you sample doesn't matter
It's the sample size itself that's important
determines the balance between how well the survey can measure the population and how much the survey costs
A "sample" of the entire population is called a census.
Populations and Parameters
A parameter used in a model for a population is called a population parameter.
Population model parameters are not just unknown — usually they are unknowable.
Take a sample and use the sample statistics to estimate them.
A sample that estimates the corresponding parameters accurately is said to be representative.
Sampling Designs
Simple Random Sample (SRS)
A sample drawn so that every possible sample has an equal chance of being selected is called a simple random sample.
With this method each combination of individuals has an equal chance of being selected as well.
A sampling frame is a list of individuals from which the sample will be drawn.
A sample-to-sample differences in values of measured variables is sampling variability.
Stratified Sampling
The population is sliced into homogeneous groups, strata
Use SRS within each stratum
Combine the results at the end
Reduced sampling variability is the most important benefit of stratifying.
Cluster and Multistage Sampling
Clustering sampling
Splitting the population into parts or clusters that each represent the population
Performing a census within one or a few clusters at random is called cluster sampling.
If each cluster fairly represents the population, cluster sampling will generate an unbiased sample.
Multistage samples
Sampling schemes that combine several methods
Systematic Samples
A systematic sample is created by selecting systematically.
For example, we might select every tenth person on an alphabetical list of employees.
To make sure our sample is random, we still must start the systematic selection with a randomly selected individual.
Sampling Designs (Example 1)
Researchers waited outside a bar they had randomly selected from a list of such establishments. They stopped every 10th person who came out of the bar and asked whether he or she thought drinking and driving was a serious problem. Identify the population of interest, population parameter, sampling frame and method.
Population of interest
Population parameter
Sampling frame
Method
Sampling Designs (Example 1, cont)
Population of interest: U.S. adults
Population parameter: Proportion who think drinking and driving is a serious problem
Sampling frame: Bar patrons
Method: Systematic sampling
Sampling Designs (Example 2)
An amusement park has opened a new roller coaster. It is so popular that people are waiting for up to 3 hours for a 2-minute ride. Concerned about how patrons feel about this, they survey every 10th person on the line for the roller coaster, starting from a randomly selected individual. Identify sampling frame. Is the sample likely to be representative?
Sampling frame
Representative
Sampling Designs (Example 2, cont)
Sampling frame: Patrons in line on that day at that time.
Representative: No. Only those who think it worth the wait are likely to be in line. Also, those who don’t like roller coasters aren’t in the sampling frame, so the poll will not get a fair picture of whether park patrons feel about long lines for roller coaster rides.
Bad Sampling
Voluntary Response Sample
A large group of individuals is invited to respond, and all who do respond are counted
Voluntary response samples are almost always biased
Often biased toward those with strong opinions or those who are strongly motivated
Often hard to define the sampling frame
Convenience Sampling
In convenience sampling we simply include the individuals who are convenient.
This group may not be representative of the population.
Bad Sampling Frame
An SRS from an incomplete sampling frame introduces bias because the individuals included may differ from the ones not in the frame.
Undercoverage
Some portion of the population is not sampled at all or has a smaller representation in the sample than it has in the population.
Rather than sending out a large number of surveys for which the response rate will be low, it is often better to design a smaller, randomized survey for which you have the resources to ensure a high response rate.
Example 1
We want to know what percentage of local doctors accept Medicaid patients. We call the offices of 50 doctors randomly selected from local Yellow Pages listings. Is this sampling method appropriate? If not, identify the problem.
Is this method appropriate?
Example 1 (cont.)
We want to know what percentage of local doctors accept Medicaid patients. We call the offices of 50 doctors randomly selected from local Yellow Pages listings. Is this sampling method appropriate? If not, identify the problem.
Method appropriate: Depends on the Yellow Page listing used. If from regular listings, this is fair if all doctors are listed. If from ads, then probably not as those doctors may not be typical.
Example 2
We want to know what percentage of local businesses anticipate hiring additional employees in the upcoming months. We randomly selected a page in the local Yellow Pages and call every business listed there. Is this sampling method appropriate? If not, identify the problem.
Is this method appropriate?
Example 2 (cont.)
We want to know what percentage of local businesses anticipate hiring additional employees in the upcoming months. We randomly selected a page in the local Yellow Pages and call every business listed there. Is this sampling method appropriate? If not, identify the problem.
Method appropriate: Not appropriate. This cluster sample will probably contain listings for only one or two business types.
Displaying and Describing Categorical Data
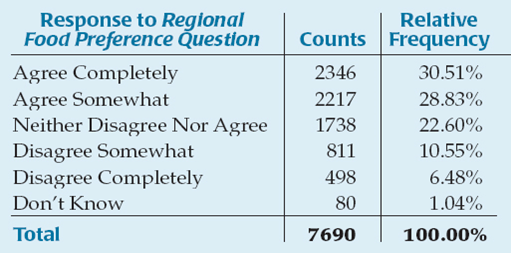
Summarizing a Categorical Variable
A frequency table organizes data by recording totals and category names.
A relative frequency table displays the percentages that lie in each category rather than the counts.
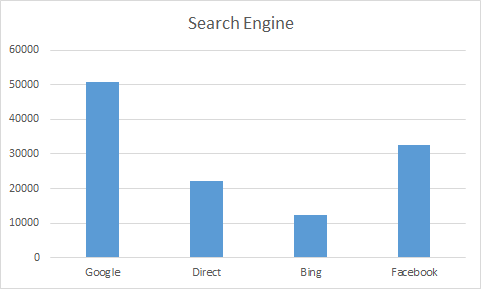
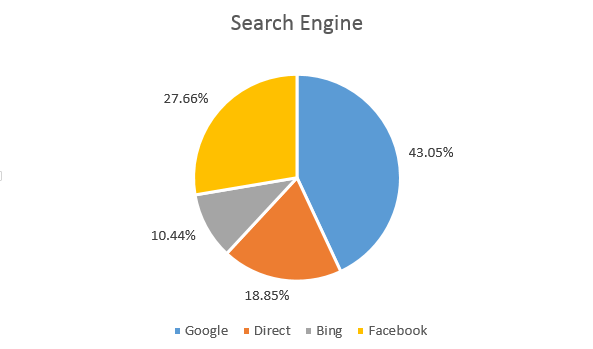
| Search Engine | Visits | Visits (%) |
|---|---|---|
| 50 629 | 43.05% | |
| Direct | 22 173 | 18.85% |
| Bing | 12 273 | 10.44% |
| 32 532 | 27.66% | |
| Total | 117607 | 100.00% |
Bar Chart
A bar chart displays the distribution of a categorical variable, showing the counts for each category next to each other for easy comparison.
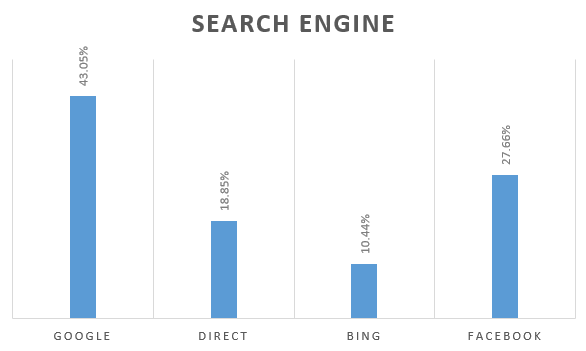
Relative Frequency Bar Chart
The relative frequency bar chart looks the same as the bar chart, but shows the proportion of visits in each category rather than counts.
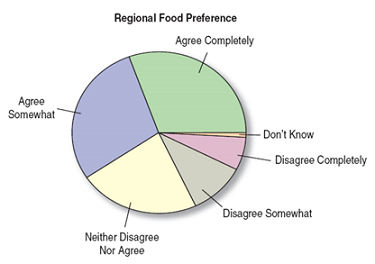
Pie Chart
Pie charts show the whole group of cases as a circle sliced into pieces with sizes proportional to the fraction of the whole in each category.
Exploring Two Categorical Variables
Example: Data was collected on the strength of consumers’ preferences for regional foods in their country. The data is displayed in the frequency table and clarified with a pie chart.
| |
|  | |––––––––––-|–––––––––––––––-|
Contingency Tables
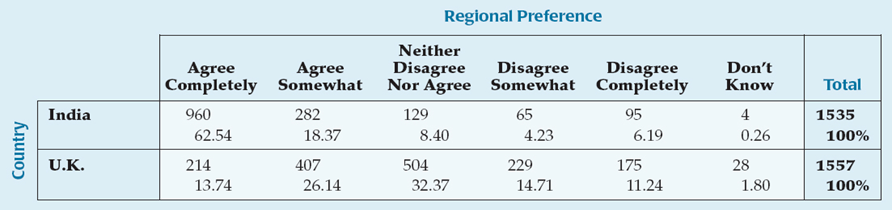
To show how opinions on regional foods varied by countries, we can display the data in a contingency table where we have added the countries as a new variable.
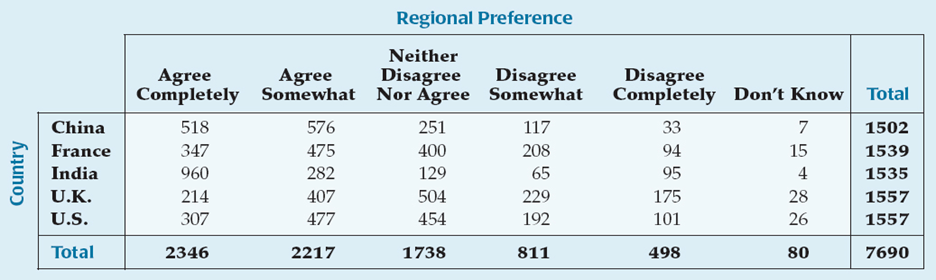
Contingency Tables (cont.)
The marginal distribution of a variable in a contingency table is the total count that occurs when the value of that variable is held constant.
Each cell of a contingency table gives the count for a combination of values of the two variables.
Rather than displaying the data as counts, a table may display the data as a percentage – as a total percent, row percent, or column percent, which show percentages with respect to the total count, row count, or column count, respectively.
Conditional Distributions
Variables may be restricted to show the distribution for just those cases that satisfy a specified condition. This is called a conditional distribution.
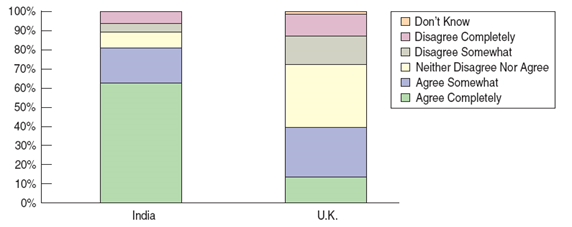
Segmented Bar Charts
Data can be displayed by dividing up bars rather than circles. The result is a segmented bar chart where a bar is divided proportionally into segments corresponding to the percentage in each group.
Example 1
GFK Roper Reports Worldwide survey in 2004, asked “How important is acquiring wealth to you?” The percent who responded that it was of more than average importance were: 71.9% China, 59.6% France, 76.1% India, 45.5% UK, and 45.3% USA.
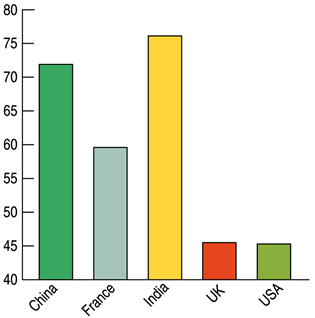
Example 1 (cont.)
The statistics reveal that India is less than twice as much as the U.S., but the graph suggests India’s percentage is about 6 times a big as the U.S.
The vertical scale beginning at 40% distorts the visual impression. Start the graph at 0%.
Example 2
A survey of the entering MBA students at a university in the United States classified the country of origin of the students, as seen in the table.
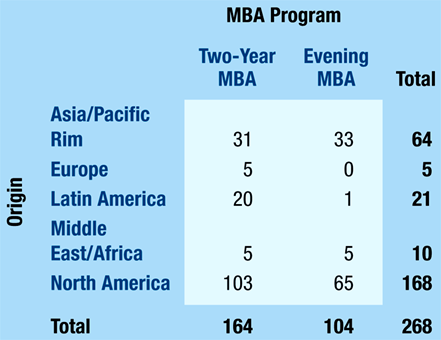
What % of all MBA students were from North America?
What % of the Two-Year MBAs were from North America?
What % of the Evening MBAs were from North America?
Example 2 (cont.)
62.7% of all MBA students were from North America.
62.8% of the Two-Year MBAs were from North America.
62.5% of the Evening MBAs were from North America.
Example 2 (cont.)
What is the marginal distribution of origin?
Example 2 (cont.)
The marginal distribution of origin is
23.9% from Asia,
1.9% Europe,
7.8% Latin America,
3.7% Middle East,
62.7% North American.
Example 2 (cont.)
Do you think that origin of the MBA student is independent of the MBA programs?
Example 2 (cont.)
Origin of the MBA student is not independent of the MBA programs because the distributions appear to be different. For example, the % from Latin America among those in Two-Yr programs is nearly 20% while those in Evening Programs is less than 1%.